


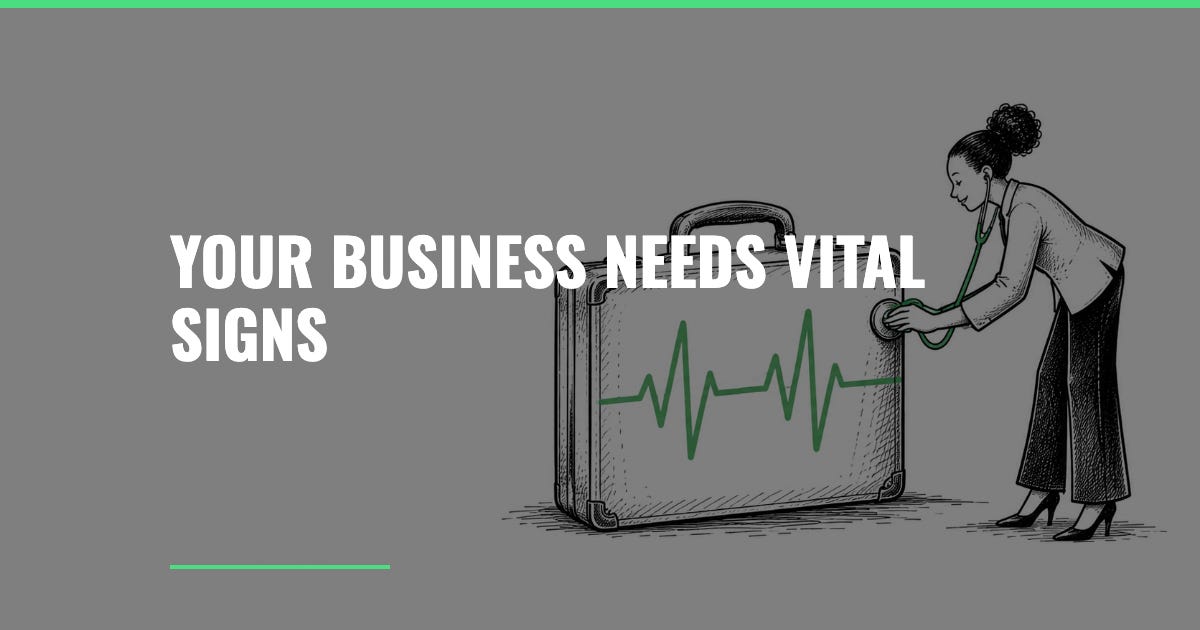
At every checkup, my doctor takes the same measurements.
Blood pressure, pulse, and weight. He knows the healthy range for each, so when one of my numbers drifts from that baseline, the next question is simple: Why? (And if it’s tax season, I already know why my blood pressure is high, smh).
Your business deserves the same kind of checkup.
For example, Maya, the fictional owner of Bright Path Consulting during our recent “Understanding Your Business Numbers” webinar series, had this scenario:
Her revenue was up 12%
Her net income was up 12%
Yet she came to us feeling a tight squeeze on cash every month.
Revenue and net income alone couldn’t explain it.
This month’s one financial move: build a one-page dashboard of your business’s vital signs, so you can spot strain early and know which lever to pull. Here’s how, in three steps.
Step #1: Measure Your Baseline
You can’t spot a change until you know your starting point.
My doctor measures my blood pressure against a healthy baseline. Your business metrics work the same way. Measuring a number once tells you nothing. Measure that same number month to month, quarter to quarter, and year over year… then you have a trend. You begin to realize what is “normal” for your business.
No need to build a full dashboard on day one! Just start with one or two metrics that you continue to measure on a consistent basis.
When/if that number moves, ask your business: Why?
That question leads you to the levers behind growth or contraction.
Watch: Your Business Needs Vital Signs, Not Just Financials
5-Minute Action Step: Choose one or two of the five vital signs in Steps 2 and 3. Write today’s number next to each one, with the date. Then set a monthly calendar reminder titled “Vital Signs Check” to measure them again.
Step #2: Check Your Profit Vital Signs
Profit ratios show how much your business keeps from every dollar of revenue it generates.
The basic three profitability ratios are":
Gross profit margin: (revenue minus cost of goods sold) ÷ revenue. For a service business, cost of goods sold is the direct cost of delivering your work, such as subcontractors or project-specific expenses.
Net profit margin: net profit ÷ revenue. This is your bottom line as a percentage of every dollar earned.
Break-even point: fixed costs ÷ gross profit margin. This is the minimum revenue you need to cover your costs. At break-even, you aren’t making money, and you aren’t losing it.
Track any or all of these over time because they can be influenced by outside forces, i.e., inflation or tariffs.
In our example, Maya’s revenue and net income both grew 12%, so her net profit margin held steady. By this measure, she was doing fine.
That’s exactly why she needed the next step.
5-Minute Action Step: Open last month’s profit and loss statement and calculate your gross and net profit margins. Then divide your monthly fixed costs by your gross profit margin to find your break-even revenue. For example, $10,000 in fixed costs ÷ 50% gross profit margin = $20,000 in monthly revenue to break even. Prefer a shortcut? Use our break-even calculator.
Step #3: Check Your Liquidity Vital Signs
Your income statement shows performance. Your balance sheet shows resilience.
Here are two liquidity ratios from the balance sheet you can track:
Current ratio: current assets ÷ current liabilities. Current assets can be turned into cash within a year, and current liabilities are debts due within a year. Ideally, this ratio sits above 1.0.
Cash ratio: cash ÷ current liabilities. This asks a stricter question: if every current bill came due at once, could your cash cover it?
In our example, Maya’s current ratio was stellar (2.5+), but her cash ratio shows her true vulnerability. Most of her liquid assets were tied up in receivables. Her cash balance alone could not cover what she owed within the year.
Here are the warning signs we covered:
Cash fell. Her bank balance dropped even in a profitable year.
Receivables grew. She had earned the money, but clients hadn’t paid yet. Her cash was sitting in other people’s hands.
New debt appeared. She started drawing on a credit line, which added another payment to cover every month.
Equity declined. The business’s net value went down despite the profit.
None of these show up on the P&L! Yet, together they signal decreased financial resilience, which is how a profitable owner feels squeezed!
Watch: Four Warning Signs Hiding on a Profitable Balance Sheet
5-Minute Action Step: Pull your latest balance sheet and find your cash balance. Next, run an accounts receivable aging report. If your system doesn’t have one, list your open invoices and their terms. Sort what’s owed into 0-30, 31-60, 61-90, and 90+ days. Then use your current liabilities to calculate your current ratio and cash ratio.
Build Your Own Dashboard
I’ve given a few examples of numbers to track. Feel free to build your dashboard with any or all of these, or add your own (for example, salaries as a percentage of revenue). The takeaway is to track the numbers consistently to understand your baseline (what’s “normal” for your business), and interrogate when you deviate from the norm.
If you want help building a dashboard that fits your business, or a second set of eyes on what your numbers are telling you, reach out at kgvirtualcfo.com/contact-us.
Cheers,
Katishia
Founder, KG Virtual CFO
P.S. Missed the webinar? The replay and notes walk through Maya’s full numbers. This newsletter is for educational purposes only and isn’t professional financial, tax, or legal advice for your specific situation.